This may sound weird in a blog post about generating content, but I hate writing. Always have. The ambiguity of word choice and the contradictory rules around grammar, it’s enough to turn left-brain thinkers off to the whole process.
Math and science were more my speed. 3 + 2 = 5 (always). With math and science, there are hard and fast formulas that are always true. Stands to reason then, that I’d go into a profession where 85% of my job is writing, often for clients, on topics I’m generally clueless on.
It wasn’t until I realized the burden I was on my coworkers that I got serious about learning to write. So I started reading everything I could—blog posts, press releases, ebooks, articles. Not just about how to write, but dissecting the content to figure out what constitutes good writing.
The more I read, the more I started to see patterns emerging in different types of writing. There were underlying structures and formulas. Blog post intros were made of three parts. Press releases all contained five elements. And so on.
For the first time, I started to see content as a formula. Equations that could be solved by adding together different variables.
I continued to dive in further and found that with specific types of content, the formula was remarkably consistent. For the Associated Press, there was virtually no structural variation between one earnings report and the next. What’s going on?
Turns out the AP writes its earnings reports using a platform called Automated Insights, which is a natural language generation (NLG) software. Little did I know how much this revelation would come to change my approach to writing.
What Is Natural Language Generation?
NLG is a software that takes structured data sets (think spreadsheets) and converts the data into plainly written, text-based pieces of content.
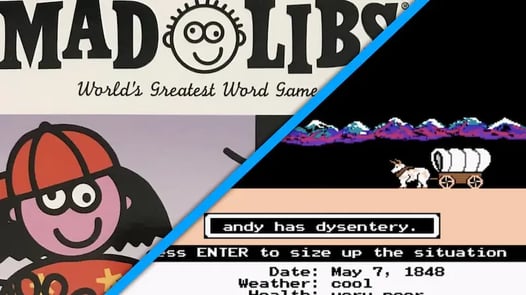
The best way I’ve found to describe it: Think Mad Libs meets Choose Your Own Adventure.

You start with a piece of content that has a bunch of blanks throughout. The NLG technology then fills in the blanks with your data. And then every so often it’ll come to a crossroads, where it’ll use your data to determine the correct version of a phrase or sentence to write.
In practice, every row in your structured dataset (spreadsheet) is a unique piece of content. You tell the NLG technology which cell from the row to insert where, and then which cell to use for conditional if/then logic. In other words, if cell B2 = “TRUE,” write this version of a sentence; if not, write this different version.
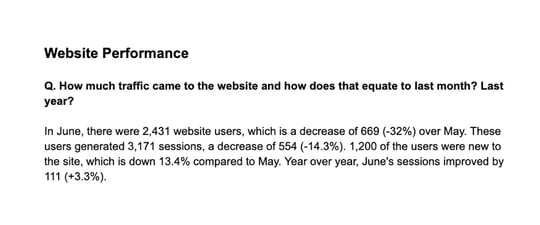
The result is a piece of content like the one pictured below. It looks like a human wrote it because a human did. The machine uses the copy you provide it and the logic you define to determine what to write and when.

4 Elements of an NLG Project
When approaching an NLG project, it helps to think about it in four specific elements. Conveniently, the acronym for these elements just so happens to spell "DATA."
Data Source

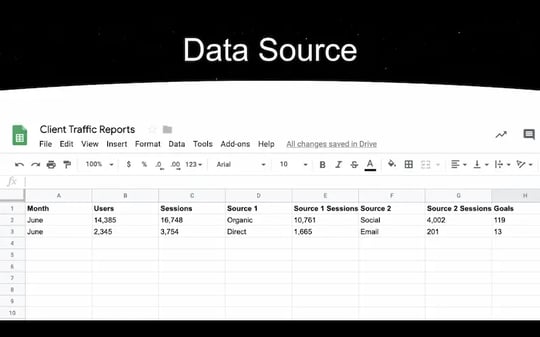
First up is your structured dataset. This can be a variety of different things, but the most common is a spreadsheet with columns and rows.
The top row includes the names of your data points. When inserting data into your template, you’ll use the names in this row to select the variables you want.
Every subsequent row includes data that can be used to create a unique narrative. If you have 50 rows, you have 50 pieces of content.
Applications
What you’re looking for here are writings that follow a standard template. Something that is written the same over and over.
We’ve termed this as formulaic writing.
Good examples include:
- Earnings reports
- Emails
- Industry trend articles
- News analysis
- Press releases
- Product descriptions
- Real estate property descriptions
- Reports
- Social shares
- Weekly recaps
Also, NLG doesn’t have to write the entire piece of content. If there is just one paragraph you can let the machine write, you’re ahead of the game.
Template
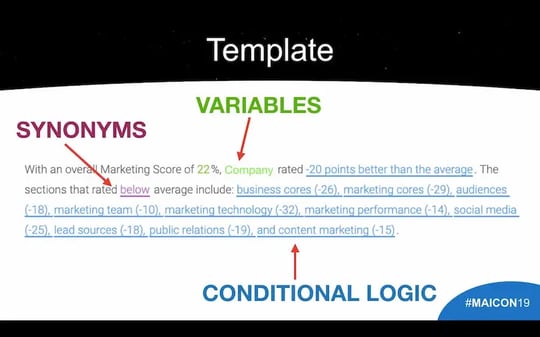
The template is the starting block of your narrative. It’s a completed version of what you’re trying to write that you’ll upload into the NLG software.

From here you’ll apply the following:
- Variables: Select the parts of the template that need to be swapped out with a data point from your structured dataset.
- Conditional Statements: This is branching if/then logic that you apply to your template, which enables you to change what is written based on data in your structured dataset.
- Synonyms: To give your NLG content some variety, you can add synonyms to change up the words or phrases used throughout the copy. The NLG software will randomly insert one from the list of options you create.
Automated Output
The end result of your NLG project is the automated output. Depending on the NLG platform you use or what it’s connected to, the fully written output can be presented in a CSV file, Word file, Google Doc, or fed directly into another technology (e.g. data visualization tool).
Tips for Getting Started
Getting started is actually easier than you’d think. Let’s cover through the five things you can start doing tomorrow.
1. Review existing content for opportunities
There are probably a number of things you currently write at regular intervals that can be automated to some extent. I’m sure your team would be happy to suggest things they’d like to hand off to a machine. Following are some questions to ask of your content.
- What content do you regularly write each month?
- Are there sections of content that are standardized?
- What data do you have access to?
- What content are competitors producing?
- What reports are generated each month?
- Do certain trends impact your industry or customers?
- What data-driven content is missing from your industry?
- Are there updates you regularly share on social?
Don’t just ask these questions of your marketing content. Talk to sales, HR, leadership, and accounting. Each also has content that could be fit for NLG.
Finally, think about this content in terms of what you are currently doing, as well as what you wish you could do or do more of. There may be a bunch of things you’d like to do, but the time and relatively small return for each couldn’t justify the manual effort. With NLG, is the return worth it?
2. Use an approved version
Always, always, always start with an approved version of whatever you’re trying to automate. If one doesn’t exist, create one and get it reviewed and signed off on. If necessary, pretend like you're about to send that version to your boss’ boss or a client. Force the approval.
Making changes after the template has been uploaded into the NLG software and built out with variables and conditional logic will add hours (maybe days) to the process.
3. Dissect the content
With the approved version in hand, start dissecting the data and information you’ll need. Highlight data points and variation opportunities. Circle synonym opportunities.
What you’re doing is creating a list of data points you’ll need for your NLG project.
Here’s the point to stress: You need to consider and note all required data points, and not just the data that will show within your content. Some data points will be needed to inform your conditionals.
For example, you’re creating new hire press releases, and you only want to show a quote from the CEO if it’s an upper-level management hire. How are you going to inform the technology that it should include a quote?
Think through every step of the process in a very linear fashion.
4. Create your structured data set
In most cases, your NLG narratives are going to be based on a row of data in a spreadsheet, more specifically a CSV file. Create a narrative spreadsheet.
Give each column a unique, easy to identify name. If your names aren’t clear, it can cause issues when inserting data points into your narrative. Best case scenario, inserting the wrong data point leads to a funny incomprehensible block of text. Worst case scenario, the mistake is so subtle you’re generating and publishing dozens of pieces of content before you realize what’s written is wrong.
5. Automate data collection
We’ve talked a lot about how much NLG simplifies writing, but the reality is a significant amount of time goes into pulling data. Streamlining data collection is the other aspect that, if done right, can further expedite this whole process.
Here are a couple ways to automate/simplify data collection.
- APIs: Many technologies that wheel and deal in data offer APIs. Any developer or even someone with a basic understanding of coding can access data via an API and feed it right into a Google Sheet via a Google Apps Script. In addition, Zapier has more than 250 Google Sheet integrations. If you’ve got a marketing technology, Zapier can probably get data into a Google Sheet for you.
- Google Forms: Google forms are free and easy to set up, and they can feed data directly into a Google Sheet. These are great for new hire releases, or situations where you need to collect specific information from individuals.
Available NLG Technologies
Choosing the right tech is obviously very important. Interestingly enough, though, there are not a lot of options out there. Fortunately, the main ones are solid technologies that are pretty easy to use.
- Automated Insights: This is the one I have the most experience with. It’s pretty easy to get up and running. It is also the self-serve option. It does offer some integrations and an API so you can pull a narrative into another platform. It can also integrate directly into several popular data visualization tools.
- Narrative Science: The other main player is Quill from Narrative Science. It's also an easy product to use and it can integrate directly into various data visualization tools. Narrative Science is more of an enterprise player and will work closely with you to get everything set up.
What Are the Benefits of NLG?
Automated Insights and Narrative Science have a ton of case studies all about the value their technologies have created for a variety of organizations.
But speaking firsthand, NLG has had a significant impact on how PR 20/20 (the services arm of Marketing AI Institute) does performance reporting.
Every month, we deliver performance reports to clients. The biggest challenge was they took three to five hours to write, the quality of the report was based on the account manager’s ability to analyze data, and with the time it takes to write, review, revise and send the reports, they weren’t being delivered until the 10th or 15th of the month.
So we tried to create an NLG narrative that solved those issues. What we came up with is a report that asks and then answers 12 questions about a company’s website, blog and lead generation performance.
Today, instead of three to five hours, reports take us 10 minutes to write. The reports are delivered on the first business day of the month, and the quality is consistent across all accounts. It’s been a huge win for our agency, and we’re actively testing other applications.
How to Get Started with AI for Content Marketing
If you're a content marketer, chances are that AI can help you increase revenue and reduce costs. That means now is the time to get started with AI, no matter your skill or comfort level.
To do so means you build a potentially insurmountable competitive advantage. To delay means you risk getting left behind.
Good news, though: You can get ahead of the pack by accessing our free Ultimate Beginner's Guide to AI in Marketing.
The Ultimate Beginner’s Guide to AI in Marketing is a free resource with 100+ articles, videos, courses, books, vendors, use cases, and events to dramatically accelerate your AI education. It's based on the years we spent on research and experimentation—and you can access this knowledge in a fraction of the time.
Keith Moehring
Keith Moehring was formally the vice president of strategic growth at Ready North. He joined the agency in July 2006, and is a 2004 graduate of the University of Toledo.


